Pie Chart Demo 01
With this widget, you can create eye-catching charts that display your data in an easy-to-understand format, making it easy for your audience to grasp complex information at a glance.
Discover the Latest Releases and Features: Check Out Our Release List Now
Discover the Latest Releases and Features: Check Out Our Release List Now
All in one e-commerce analytics
Transform your programming workflow by leveraging the power of AI and improve your coding efficiency, accuracy, and productivity.
Pie Chart Demo 02
Whether you’re presenting financial data, marketing analytics, or any other type of information, the Elementor Pie Chart Widget is the perfect way to showcase your data in a clear and compelling way.
Effortlessly stay on top of your tasks
Streamline your task management with Managely, the ultimate tool for staying organized and productive.
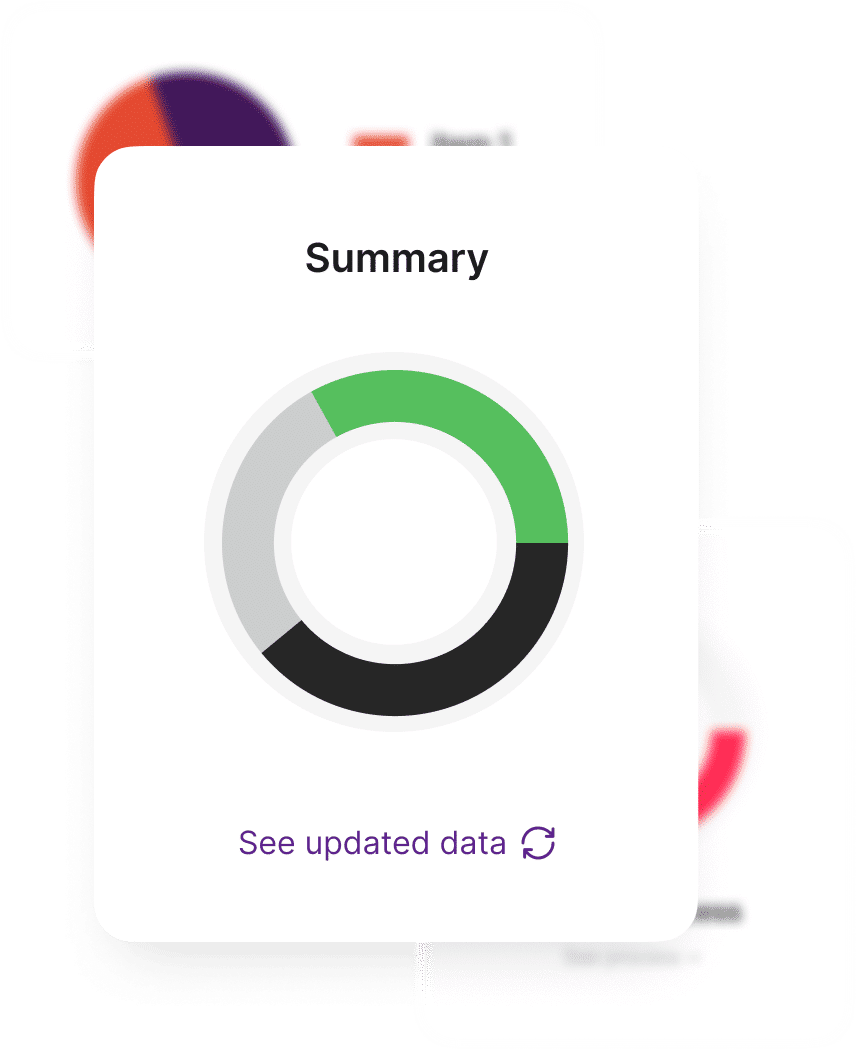
Summary
Your total data
Pie Chart Demo 03
With a variety of customization options, you can easily tailor the widget to fit the style of your website and your brand, ensuring that your charts look professional and polished.
Bringing Your Data to Life: The Power of Visualization
Unlock the insights hidden within your data through effective and impactful visualization techniques.
Pie Chart Demo 04
You can create stunning charts in just minutes, without any coding or technical skills required.
Paid marketing conversion tracker
Understand which channels are really providing you with quality traffic. Double down on whats providing your real results.
Pie Chart Demo 05
So what are you waiting for? Try the Elementor Pie Chart Widget today and start presenting your data like a pro!