Introducing the JupiterX Pie Chart Widget – the ultimate tool for visualizing your data in a sleek and stylish way!
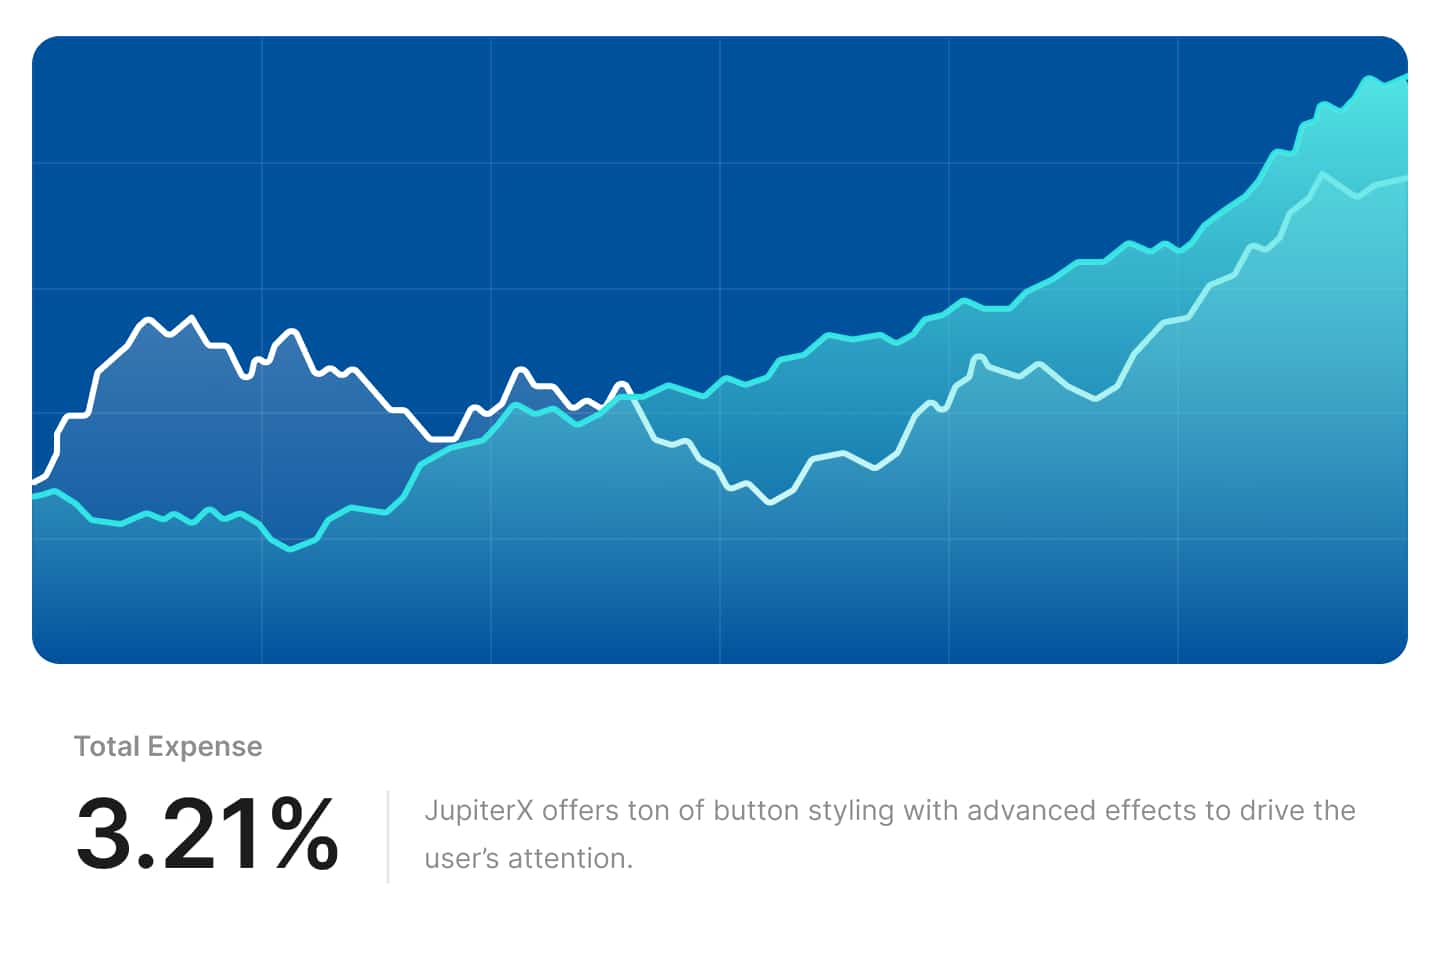
Line Chart Demo 01
With this widget, you can create dynamic charts that showcase your data trends over time, making it easy for your audience to understand complex information at a glance.
Whether you’re presenting financial data, market trends, or any other type of information, the Elementor Line Chart Widget is the ideal way to visualize your data with precision and accuracy.
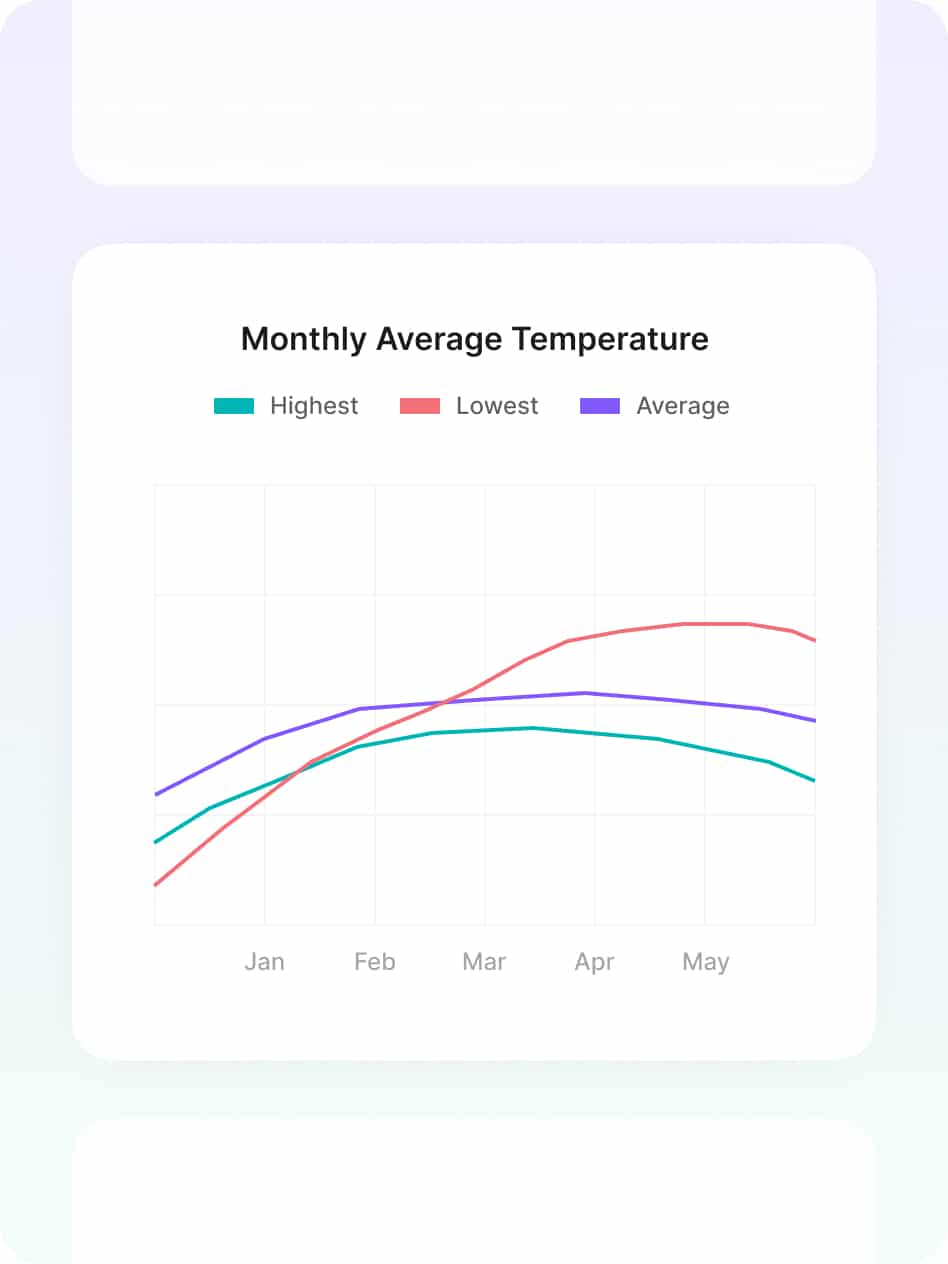
ThermoVision: A Dynamic Temperature Visualization Plugin
Experience real-time temperature visualization with ThermoVision – the ultimate plugin for gaining insights into your data.
With a range of customization options, you can tailor the widget to match the style of your website and your brand, ensuring that your charts look polished and professional.
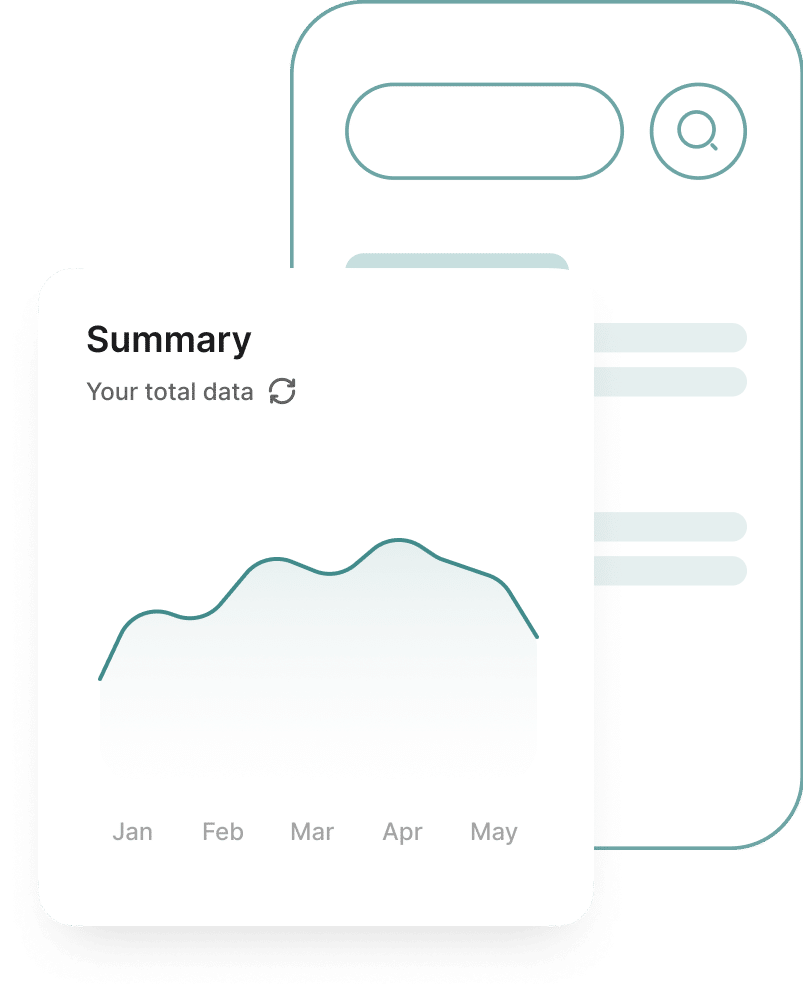
Mobile Tracker Pro: Keep tabs on your daily phone usage
This easy-to-use app helps you track your daily phone activities, including app usage, phone calls, and text messages.